How many housing code violations has your building had this year? What zoning proposals are under review in your neighborhood? Is the empty lot next door staying that way or is development scheduled?
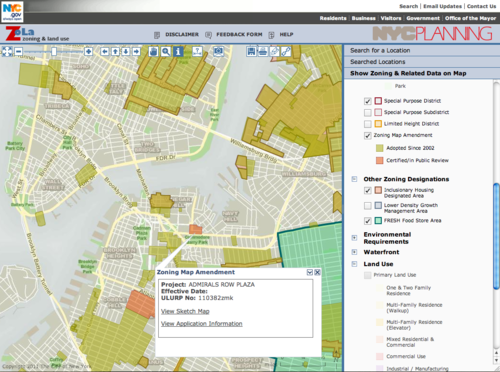
Giving a new level of public access to city zoning information, the Department of City Planning recently released the Zoning and Land Use web map (ZoLa), which pulls from at least a dozen different data sources to present NYC zoning, land use and economic development information via a single color-coded, interactive map that also serves as an interface to the repository of city planning documents, schematics and regulations that are spread across the city planning website.
Users can view environmental hazards, political boundaries, land usage, and special development zones, track zoning changes, and view drawings of proposed projects and acceptable building types for each zone. The data is updated monthly and users can search by address, intersection or lot number as well as overlay areas with a color-coded key.
Although most of this data has always been public, finding it was the big challenge. For instance, many areas in the city are flagged as special economic development zones, where businesses are eligible to receive incentives. If you had a city zone number, you could look through a table of over a hundred PDF sketches to find the corresponding map and see if it was highlighted as a special district. Then, to find which program it fell under, you would refer to the NYC Planning Special Districts microsite to do more digging.
On ZoLa, though, you simply tick the checkbox on the right that lists different development programs,and the special districts appear in bright colors. In the pop-up menu, you can also click through to get primers on zoning designations and more info about each initiative. You can even export images to create your own static maps.
The viewable map layers range from basic information about what kind of development exists on a site — is it a single-family home, an apartment building, a commercial property or something else? — to overlays showing areas covered by recent city initiatives. Turn on the Inclusionary Housing Area checkbox to see where in the city real estate developers must include affordable housing in order to qualify to build larger buildings. The FRESH Food Store Areas view shows neighborhoods identified by the city as lacking adequate access to grocery stores and fresh food, and where supermarkets receive special incentives to operate. These codes can be overlaid with congressional, state assembly, and City Council or community board districts, as well, to see how infrastructure intersects with politics.
ZoLa isn’t perfect. Under some of the categories, colors will only appear once the view is zoomed in to street level. If you’re used to the Google Maps interface, ZoLa may be confusing at first. To drag, zoom, measure distances, or get info about a specific zone, you have to select the appropriate tool from the three buttons at the top of the map.
Also, when you click on an item for more information, some of the links don’t work unless you right-click (control-click on a Mac) and select to open the link in a new window or tab. This bug is a drawback since the richness of ZoLa comes out in its power to link to resources for further digging. For instance, if you tick the Zoning Map Amendment overlay under the Zoning category you can see that Admiral’s Row in Brooklyn is highlighted in red. This proposed rezoning will permit construction of a supermarket in this underserved area, which includes several public housing projects. If you click on the area, then right-click on the application information link to open it, you get into DCP’s Land Use and CEQR Application Tracker (LUCATS) system where you can see artist’s renderings and see a calendar of past and future public hearings.
NYC Planning put a year and a half’s worth of work into ZoLA, and it opens an impressive amount of data to developers, journalists, businesses and the curious public. Many of the layers are also in the NYC Datamine and Bytes of the Big Apple for download as shape files. Unfortunately, the office doesn’t have any immediate plans to create an API to query their database directly.